Same Data - Different Intervals
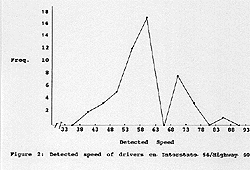
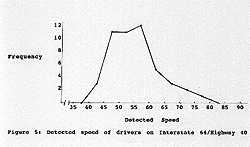
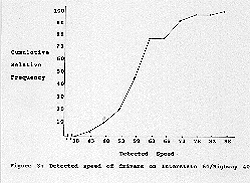
There is an error in the graph! Can you spot it?
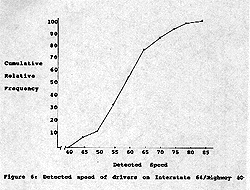
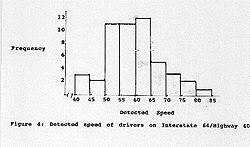
| Interval - Detected Speed | Frequency | Relative Frequency | Cumulative Relative Frequency |
| 80 - 84 | 1 | 2 | 100 |
| 75 - 79 | 2 | 4 | 98 |
| 70 - 74 | 3 | 6 | 94 |
| 65 - 69 | 5 | 10 | 88 |
| 60 - 64 | 12 | 24 | 78 |
| 55 - 59 | 11 | 22 | 54 |
| 50 - 54 | 11 | 22 | 32 |
| 45 - 49 | 2 | 4 | 10 |
| 40 - 44 | 3 | 6 | 6 |
Or
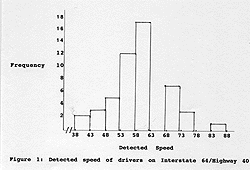
| Interval - Detected Speed | Frequency | Relative Frequency | Cumulative Relative Frequency |
| 83 - 87 | 1 | 2 | 100 |
| 78 - 82 | 0 | 0 | 98 |
| 73 - 77 | 3 | 6 | 98 |
| 68 - 72 | 7 | 14 | 92 |
| 63 - 67 | 0 | 0 | 78 |
| 58 - 62 | 17 | 34 | 78 |
| 53 - 57 | 12 | 24 | 44 |
| 48 - 52 | 5 | 10 | 20 |
| 43 - 47 | 3 | 6 | 10 |
| 38 - 42 | 2 | 4 | 4 |
Note that by simply changing the selected intervals, the frequency tables represent the data differently. Each will be graphed below. Note the differences.
| Histogram | Histogram |
 |  |
| Frequency Polygon | Frequency Polygon |
 |  There is an error in the graph! Can you spot it? |
| Ogive | Ogive |
 |  |