| Source | SS | df | MS | F |
| Age | 180 | 2 | 90.00 | 49.09 |
| Gender | 30 | 1 | 30.00 | 16.36 |
| Age x Gender | 0 | 2 | 0.00 | 0.00 |
| Within | 44 | 24 | 1.83 | |
| Total | 254 | 29 | ||

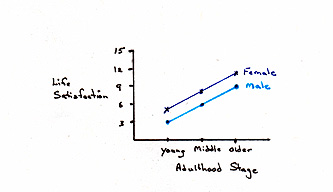
Without post hoc tests it is difficult to know where differences lie specifically. There are significant main effects for age (F=49.09 (2,24), p<.01) and gender (F=16.36 (1, 24), p<.01). There is no interaction effect (F=0.00 (2,24), not significant).
I appears from the data that older adults have the highest life satisfaction and younger adults have the lowest life satisfaction. Women also have significantly higher life satisfaction than men.